用R编写简单线性回归模型实现
 发布于2024-11-22 阅读(0)
扫一扫,手机访问
简单线性回归是一种用于研究两个连续变量之间关系的统计方法。其中,一个变量被称为自变量(x),另一个变量被称为因变量(y)。我们假设这两个变量之间存在线性关系,并试图找到一个线性函数,以自变量的特征来准确预测因变量的响应值(y)。通过拟合一条直线,我们可以得到预测的结果。这个预测模型可以用来理解和预测因变量如何随着自变量的变化而变化。
为了理解这个概念,我们可以借助一个薪水数据集,其中包含了每个自变量(经验年限)对应的因变量(薪水)的值。
薪资数据集
年薪和经验
1.1 39343.00
1.3 46205.00
1.5 37731.00
2.0 43525.00
2.2 39891.00
2.9 56642.00
3.0 60150.00
3.2 54445.00
3.2 64445.00
3.7 57189.00
出于一般目的,我们定义:
x作为特征向量,即x=[x_1,x_2,....,x_n],
y作为响应向量,即y=[y_1,y_2,....,y_n]
对于n次观察(在上面的示例中,n=10)。
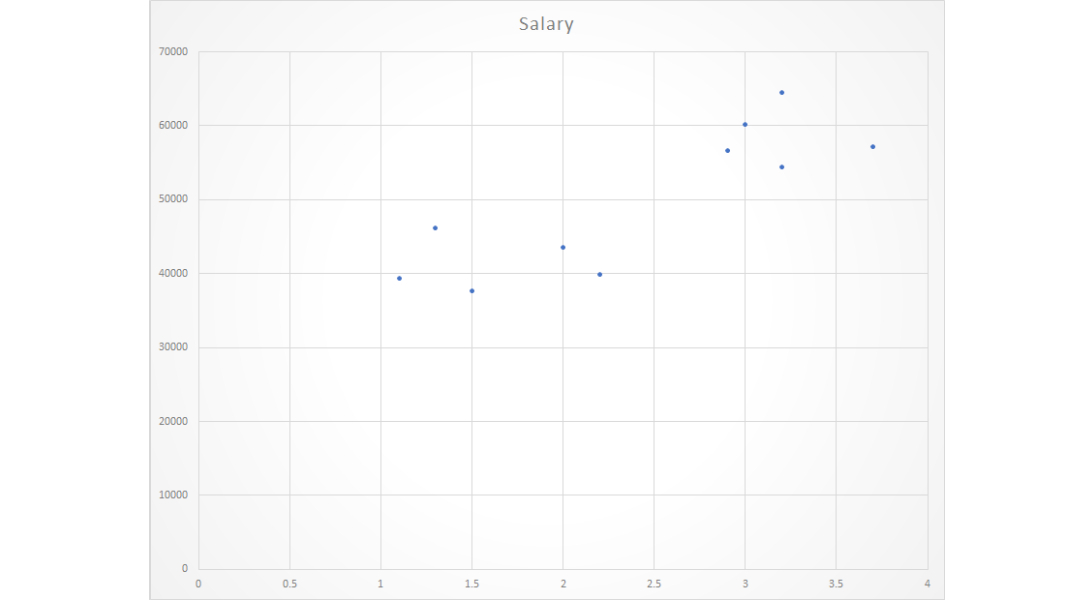
给定数据集的散点图

现在,我们必须找到一条适合上述散点图的线,通过它我们可以预测任何y值或任何x值的响应。
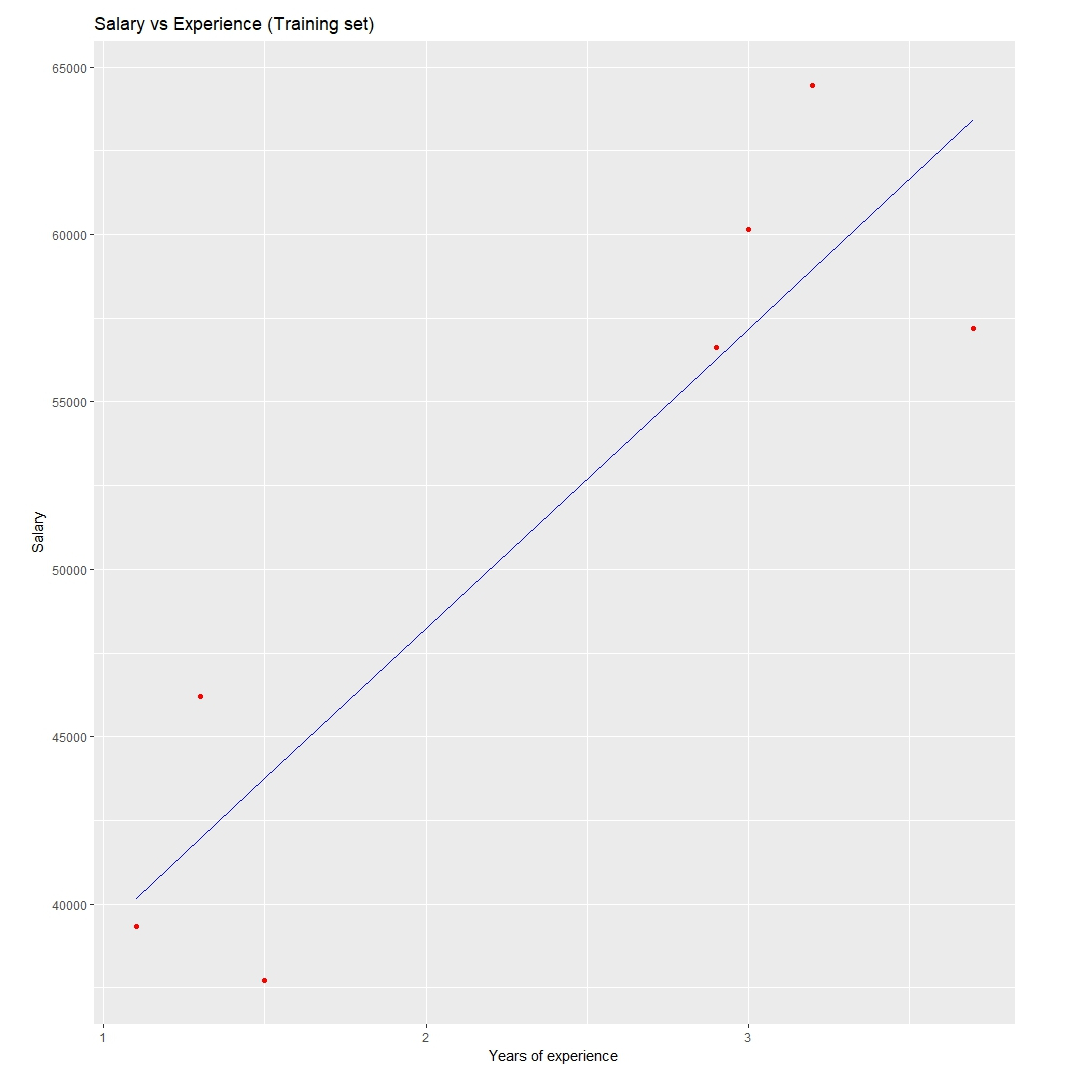
最适合的线称为回归线。
以下R代码用于实现简单线性回归
dataset=read.csv('salary.csv')
install.packages('caTools')
library(caTools)
split=sample.split(dataset$Salary,SplitRatio=0.7)
trainingset=subset(dataset,split==TRUE)
testset=subset(dataset,split==FALSE)
lm.r=lm(formula=Salary~YearsExperience,
data=trainingset)
coef(lm.r)
ypred=predict(lm.r,newdata=testset)
install.packages("ggplot2")
library(ggplot2)
ggplot()+geom_point(aes(x=trainingset$YearsExperience,
y=trainingset$Salary),colour='red')+
geom_line(aes(x=trainingset$YearsExperience,
y=predict(lm.r,newdata=trainingset)),colour='blue')+
ggtitle('Salary vs Experience(Training set)')+
xlab('Years of experience')+
ylab('Salary')
ggplot()+
geom_point(aes(x=testset$YearsExperience,y=testset$Salary),
colour='red')+
geom_line(aes(x=trainingset$YearsExperience,
y=predict(lm.r,newdata=trainingset)),
colour='blue')+
ggtitle('Salary vs Experience(Test set)')+
xlab('Years of experience')+
ylab('Salary')
可视化训练集结果

本文转载于:https://fuxi.163.com/database/114 如有侵犯,请联系admin@zhengruan.com删除
下一篇:旌宇显卡的质量如何?
产品推荐
-

售后无忧
立即购买>- DAEMON Tools Lite 10【序列号终身授权 + 中文版 + Win】
-
¥150.00
office旗舰店
-

售后无忧
立即购买>- DAEMON Tools Ultra 5【序列号终身授权 + 中文版 + Win】
-
¥198.00
office旗舰店
-

售后无忧
立即购买>- DAEMON Tools Pro 8【序列号终身授权 + 中文版 + Win】
-
¥189.00
office旗舰店
-

售后无忧
立即购买>- CorelDRAW X8 简体中文【标准版 + Win】
-
¥1788.00
office旗舰店
-
 正版软件
正版软件
- 莱特币最早在哪个交易所
- 莱特币首次交易于2011年12月27日,在Cryptsy交易所进行,该交易所以其广泛的加密货币交易对而闻名。莱特币在Cryptsy上的首次交易对是LTC/BTC,意味着交易者可以用比特币购买莱特币。
- 7分钟前 0
-
 正版软件
正版软件
- 狗币钱包地址APP
- 狗币钱包地址APP是一种移动应用程序,允许用户存储、发送和接收狗币。其主要功能包括:1)存储狗币;2)发送狗币;3)接收狗币;4)查看交易历史;5)查看价格图表。该应用程序提供方便、安全、实用的功能,并支持iOS和Android设备。
- 22分钟前 0
-
 正版软件
正版软件
- 加密货币到底有什么价值
- 加密货币的价值基于其稀缺性、安全性、对冲通胀的能力、交易效率、分散化以及投机潜力。
- 37分钟前 0
-
 正版软件
正版软件
- 加密货币交易所app
- 加密货币交易所应用程序是移动软件,允许用户买卖和管理加密货币,提供便捷性、安全性、货币多样性、实时数据和移动警报功能。在选择应用时,需考虑货币支持、安全措施、费用、用户界面和客户支持等因素。使用时需选择信誉良好的应用,启用安全功能,谨慎交易,存储少量加密货币并跟踪交易。
- 52分钟前 0
-
 正版软件
正版软件
- 2025年狗狗币能涨多少
- 2025年狗狗币价格预测在0.2至1美元之间,具体取决于社区增长、名人代言和可用性等因素;然而,波动性、监管和竞争也可能导致价格下跌。
- 1小时前 05:55 0
最新发布
-
 1
1
- 阿里追捧的中台,“热度”退了?
- 1897天前
-
 2
2
- Overture设置踏板标记的方法
- 1734天前
-
 3
3
- 思杰马克丁取得CleanMyMac中国区独家发行授权
- 1724天前
-
 4
4
- IBM:20万台Mac让公司职工在工作中更快乐 更多产
- 1922天前
-
 5
5
- 报道称微软一直在悄然游说反对“维修权”立法!
- 1888天前
-
 6
6
- 美国怀疑华为窃取商业机密 华为:身正不怕影子斜
- 1884天前
-
 7
7
- 三星被曝正与联发科接洽 A系列手机有望搭载其5G芯片
- 1899天前
-
 8
8
- 环球墨非完成千万级融资 联合企业集团投资
- 1920天前
-
 9
9
相关推荐
热门关注
-

- Xshell 6 简体中文
- ¥899.00-¥1149.00
-

- DaVinci Resolve Studio 16 简体中文
- ¥2550.00-¥2550.00
-

- Camtasia 2019 简体中文
- ¥689.00-¥689.00
-

- Luminar 3 简体中文
- ¥288.00-¥288.00
-

- Apowersoft 录屏王 简体中文
- ¥129.00-¥339.00